
The operating metric behind EBITDA.
Organizational Alignment Score (OAS™) measured across every company in your portfolio.
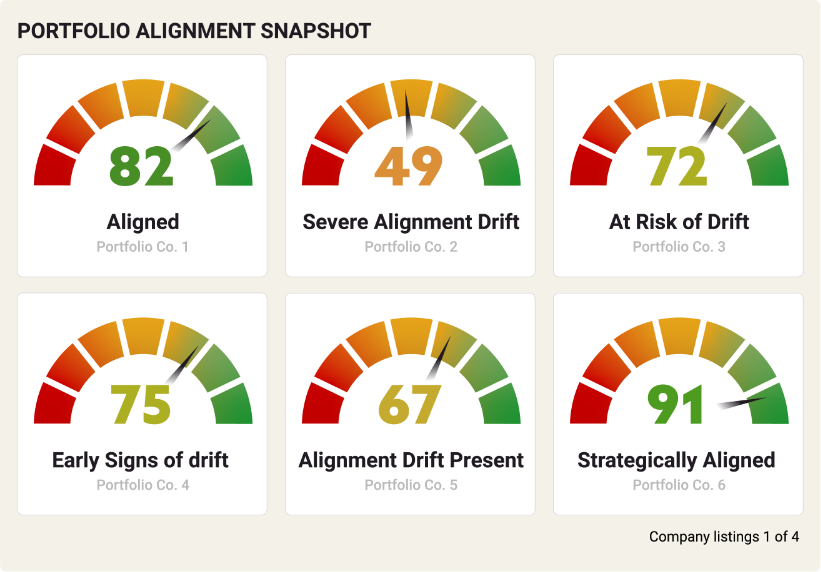
Execution risk is hidden across your portfolio
You’re already losing value, you just can’t see where yet. It shows up in how strategy is interpreted and executed across your companies.

Leadership Drift
Leadership teams interpret strategy differently post-transaction.

Conflicting Priorities
Departments execute against competing objectives

Rapid Hiring Impact
Scaling teams dilutes strategic clarity.

Execution Variance
Falling productivity and lost revenue.
What your EBITDA doesn't show you.
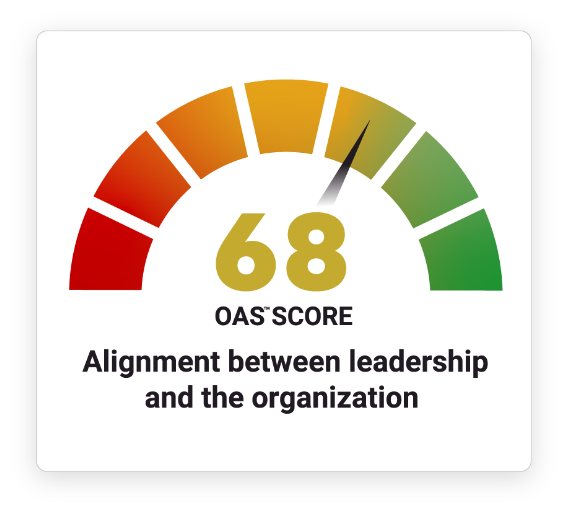
OAS™ turns alignment into a portfolio operating metric.
Leadership now has a score showing how well strategy, priorities, and execution are
aligned across the organization.
Detect Execution Risk Early
See where strategy is breaking down before it hits performance.

Enforce Strategic Alignment
Give leadership a measurable way to verify whether teams understand and execute
priorities.
priorities.

Protect Execution Momentum
Reduce drift, rework, delay, and inconsistent execution across the portfolio.
Alignment becomes a governed operating condition.
Alignment is no longer assumed. It is measured and managed across the portfolio. OAS gives leadership a real-time view of how strategy is being executed before misalignment impacts performance and returns.
OAS™ shows you what’s actually driving your results.
