A New Executive Metric
Strategy begins to drift at launch. OAS™ tells you where.
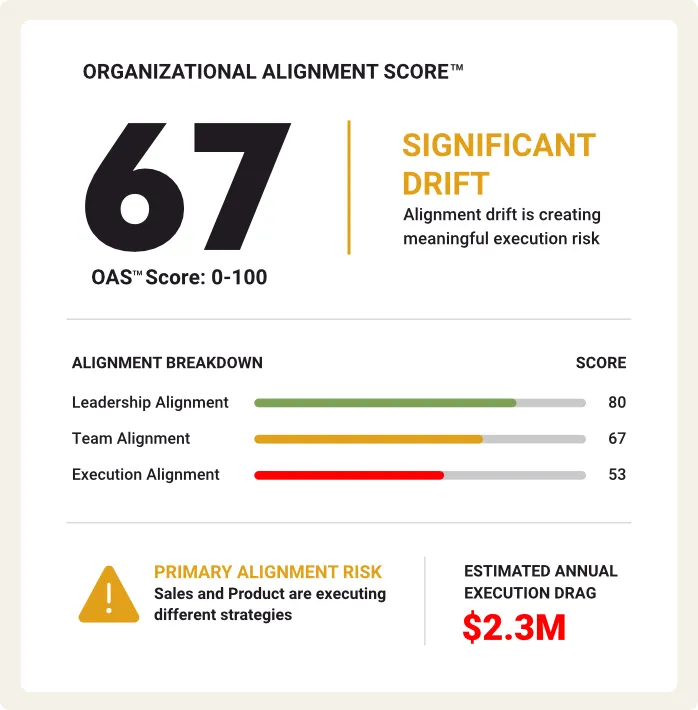
OAS™ reveals where strategy is interpreted differently before it affects execution.
Before you execute your next strategy,
confirm your organization shares the same understanding.
Example OAS™ Results
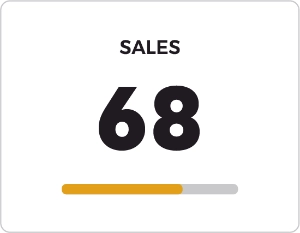
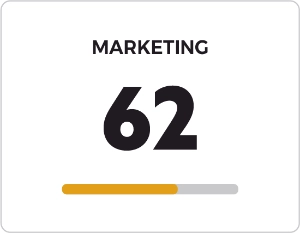
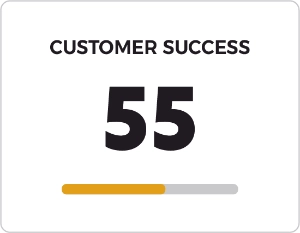
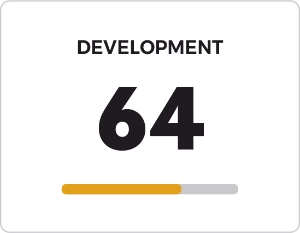
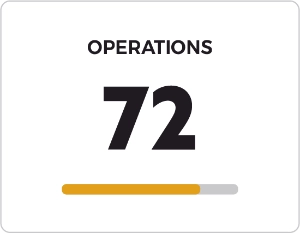
One strategy. Five different interpretations.
Alignment Drift™ begins as strategy moves from leadership into execution.
Alignment Drift™ accelerates during:

Rapid Growth
Scaling teams, systems, and priorities
Mergers & Acquisitions
Bringing teams together around a shared strategy.

Leadership Transitions
New leadership. New direction. Same need for alignment.

Strategic Change
New initiatives succeed when teams align.
Here's how Alignment Drift™ shows up.
Priorities compete instead of align. Execution slows, and the cause isn't visible.

Mixed Messages
Conflicting priorities in every conversation.

Siloed Efforts
Teams working in isolation and secrecy.

Project Delays
Timelines slipping and deadlines missed.

Missed Targets
Falling productivity and lost revenue.
See what misalignment is costing your organization
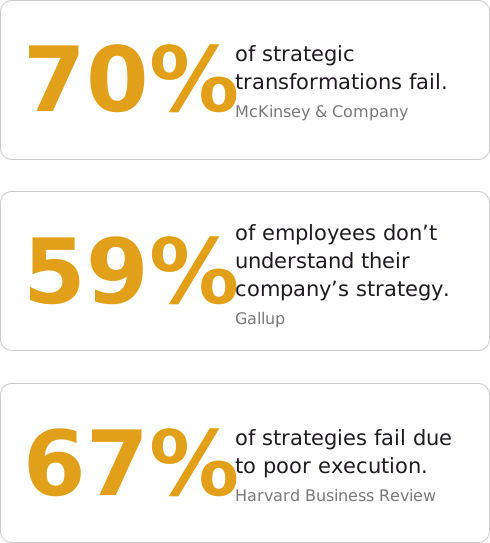
The research confirms what leaders experience.
Execution feels harder than it should. Momentum slows. Outcomes become less predictable.
Most leaders blame headcount, market conditions, or timing.
The data is already there. OAS™ makes it visible.

.svg)
.svg)
OAS™ isn't just a score.
It's the beginning of an operating discipline.
Visibility is where alignment begins. Governance is how it stays aligned.





Understand
Learn how alignment drift develops.
Measure
Establish your OAS™ baseline.
Govern
Maintain alignment with CAP™.
Improve
Strengthen execution over time.
Govern alignment. Don't just measure it.
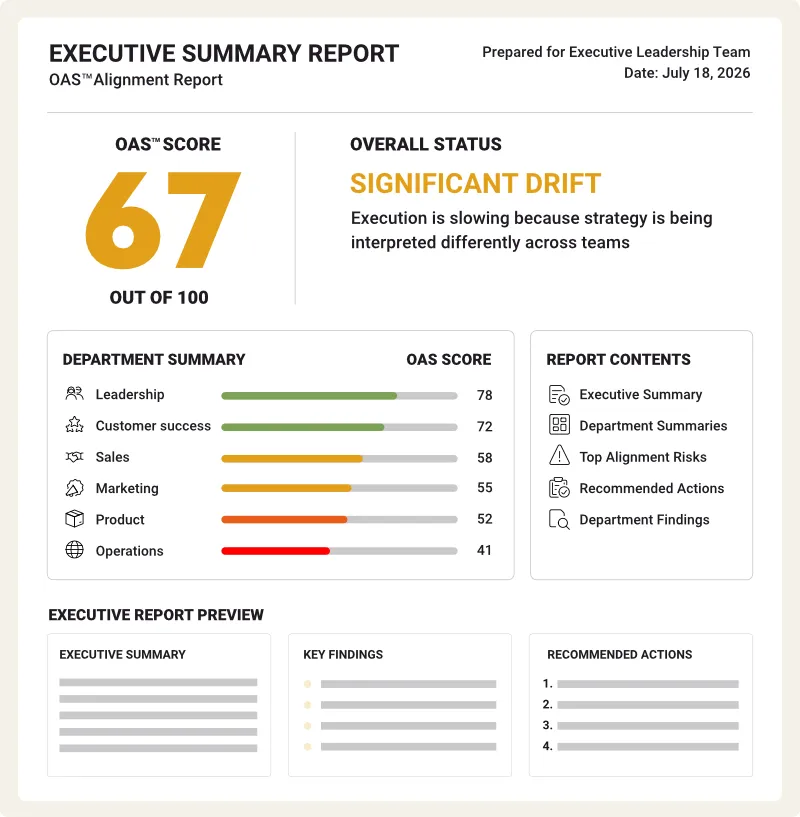
One report.
One score.
Complete alignment visibility.
The executive report every leadership team needs.

Overall OAS™ Score
Your organization's alignment baseline

Department Summary
See where alignment is strongest and weakest.

Top Alignment Risks
Identify where execution is most at risk.

Recommended Actions
Know where leadership should focus next.
One executive view. Better decisions.