
What Is an Organizational Alignment Score™ (OAS™)?
Revenue is a lagging indicator. By the time it drops, the problem has already been building for months. The OAS™ is a leading indicator. It tells you what’s coming before it shows up in your numbers.
Every organization tracks financial performance. Most track operational metrics. Very few track the one metric that sits upstream of all the others: how well their teams actually understand and are executing the strategy leadership believes it has communicated.
That metric is the Organizational Alignment Score™. The one metric your other metrics depend on.
The Definition
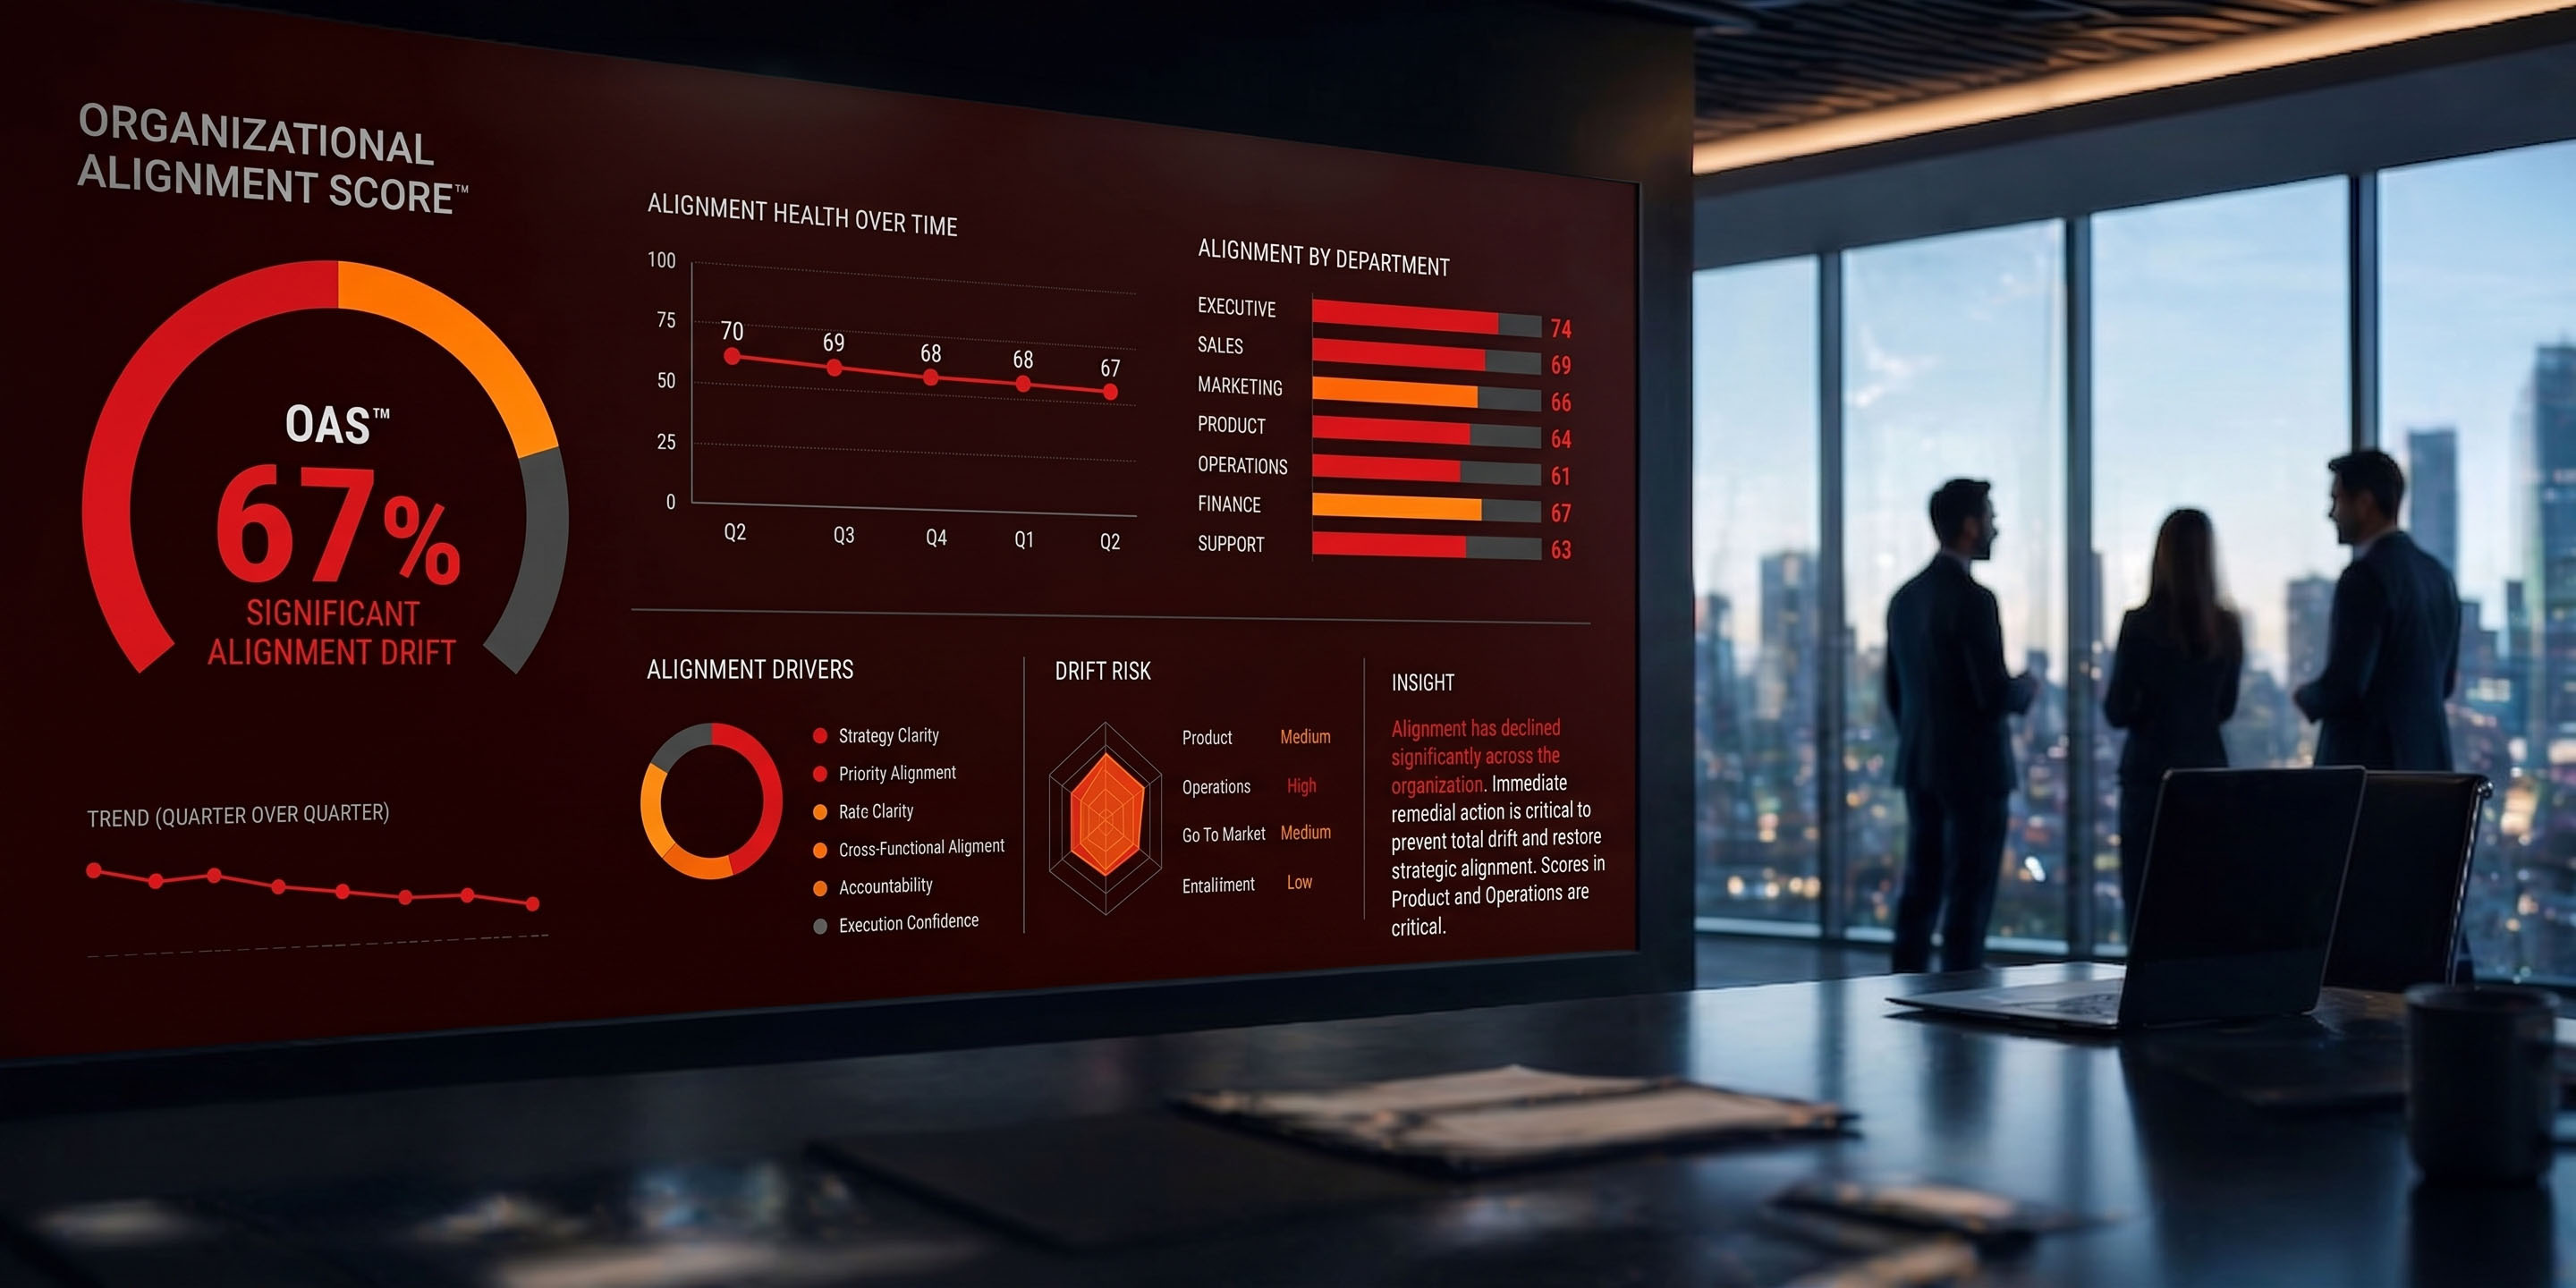
The Organizational Alignment Score™ (OAS™) is a single, executive-level metric that quantifies how consistently an organization’s teams understand its strategy, priorities, and direction.
It is not an engagement score. It is not a culture rating. It is not a sentiment survey. The OAS™ measures comprehension — specifically, the degree to which teams across the organization understand strategy the same way leadership does.
That distinction matters. An organization can have high morale and low alignment. Teams can feel committed and still be executing against a different version of the strategy than leadership intended. The OAS™ measures what’s actually happening, not how people feel about it.
Why It’s a Leading Indicator
Most executive metrics are outcome metrics. Revenue, EBITDA, churn, CAC — these tell you what happened. They are valuable for measuring results. They are not useful for preventing problems.
The OAS™ is different. It measures the condition that produces those outcomes.
When OAS™ is high, strategy translates into consistent decisions across the organization. Execution aligns. Performance compounds. When OAS™ is low, strategy fragments. Departments drift. Execution slows. And eventually — weeks or quarters later — those effects appear in the financial results.
By the time declining alignment shows up in revenue, CAC, or churn, the underlying issue has already spread across the organization. The value of the OAS™ is that it gives leadership visibility at the source — before the financial damage is done.
What a Low OAS™ Costs
A low OAS™ is not an abstract warning. It is a direct predictor of operational and financial deterioration. Organizations with low alignment consistently experience the same set of symptoms.
Declining sales. When teams are not operating from the same strategic understanding, go-to-market execution fractures. Sales, marketing, and delivery pull in different directions. Pipeline slows. Close rates drop.
Eroding ROI. Budget gets deployed against competing interpretations of the strategy. Resources are duplicated, misdirected, or wasted entirely. The return on every dollar invested decreases as misalignment compounds.
Falling productivity. Teams spend time reworking decisions that should have been made once. Cross-functional handoffs break down. Initiatives stall waiting for clarity that should already exist.
Disconnected employees. When people don’t understand how their work connects to the organization’s direction, engagement drops. The best performers — those with options — leave first.
Execution drag. Decisions take longer. Priorities shift. Leaders find themselves having the same conversations repeatedly without resolution. The organization moves, but not together.
These symptoms are rarely attributed to alignment. They get blamed on market conditions, team performance, or strategic decisions. But for most organizations experiencing them, the root cause is the same: the strategy leadership believes it is executing is not the strategy the organization is operating from.
What It Measures
The OAS™ is generated from structured assessments run across the organization using AlignDrift’s proprietary measurement methodology. The assessments evaluate comprehension across a defined set of strategic criteria — not opinions, not sentiment, not satisfaction.
Each criterion is scored individually. The aggregated result is the OAS™. This structure gives leadership both the headline number and the diagnostic detail — a single score to track at the board level, and criterion-level data to act on at the department level.
The result is a clear, executive view of where alignment is strong, where drift is forming, and where leadership action is required. No interpretation required. The report is written for decision-makers, not analysts.
How It’s Used
The OAS™ functions like any other executive operating metric. It is tracked on a consistent cadence. It is reviewed alongside financial results. And it is used to make decisions about where leadership attention and resources are needed most.
After each assessment cycle, AlignDrift™ delivers a standardized executive report. The report is concise, plain-language, and action-oriented. It contains the headline OAS™, department-level findings, identified drift areas, areas of strong alignment, and prioritized recommendations. Critically, it also provides executive direction on how to get back into alignment — so leadership leaves with a clear path forward, not just a score.
For PE-backed organizations, the OAS™ provides a consistent view across portfolio companies. Operating partners can track alignment health across the portfolio and identify which companies carry execution risk — before it surfaces in financial performance.
The Metric Behind Your Other Metrics
Every organization measures outcomes. Revenue. Retention. Pipeline. These metrics are essential.
But outcome metrics can always be rationalized. A missed revenue target can be attributed to market conditions, a bad quarter, a competitor move. Outcome metrics tell you what happened — they rarely tell you why, and they almost never tell you what’s coming next.
The OAS™ measures the health of the execution engine itself. If alignment is declining, every other performance metric is at risk. If alignment is strong, leadership has a measurable basis for confidence in the organization’s ability to execute.
That is why it is an operating metric, not a program or initiative. It is tracked. It is governed. And it is used to make decisions — the same way any serious executive metric is used.
Do You Know Your OAS™?
Most organizations assume alignment. AlignDrift™ measures it.
If you don’t know your OAS™, you don’t know whether the execution capacity you’re counting on actually exists. For most organizations above 100 employees, the gap is already present — and already costing them.